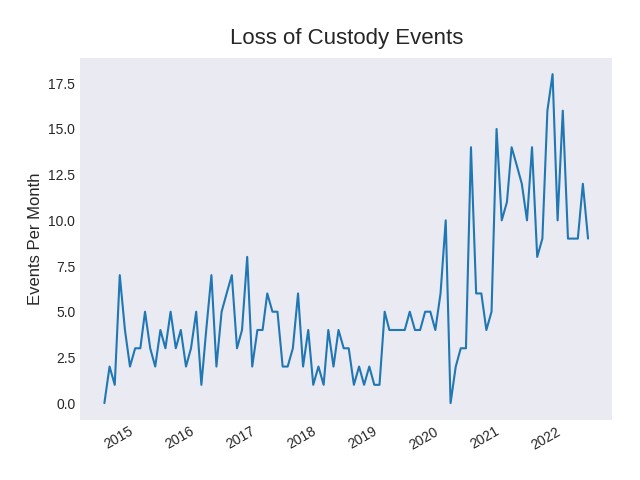
In June 2023, I published a story in the Virginia Mercury about how hundreds of Virginians in mental health crisis are falling through the cracks of the state’s psychiatric care system. The heart of that story was a data trend that wasn’t visible in any press release or summary — it was buried deep inside a multi-table PDF I obtained from the Department of Behavioral Health and Developmental Services.
I was able to extract data concerning “loss of custody” events when a patient leaves the care facility despite needing help and using Python turn it into a graph that illustrated how those incidents had spiked following the 2020 Covid-19 pandemic.
Following that report, I recorded a walkthrough of how I used a module called PDFplumber and uploaded it to YouTube along with my code. Over time, it became my most popular video with over 22,000 views as of May 2025.
I received many positive comments in response to the video:
“Simple and super, easy to understand”
“Hey man watching from México. This is great! I’m a chemist trying to move to the data space and this explanation helped me a lot to build a script to extract Medical Device adverse events report data from PDFs with hundred of tables. I’m just a newbie on python but using as a base the analysis and logic that you applied to your case and with the support of chatgpt haha I was able to build the script with 1 prompt. Thanks a lot!”
“Mr Caterine, you are gifted at sharing technical knowledge. I’m watching this video from a southwestern city not far from Shangri-la. Thank your for your step by step articulation demonstration. Learn and practice a lot.”
You can watch the video here:

Leave a comment