Like many in the Historic Triangle area of Virginia, I’ve been following the Williamsburg-James City County school division’s redistricting process that kicked off over a year ago. At a meeting of the WJCC school board earlier this summer, superintendent Daniel Keever mentioned that the division would be publishing the full results of a survey they had conducted about redistricting by the end of June. I set a reminder knowing I’d want to dig into the data once released, as previously I’ve found interesting results in WJCC survey data.
Once it was released, I downloaded the PDF and started scrolling through it, but it was over 3,000 pages and I didn’t feel like I was getting a good overall picture. I used Claude Code to generate some data visualizations, which were helpful, but I didn’t trust AI to parse the written survey responses (as opposed to multiple choice) because it always ends up interpreting things wrong and making stuff up.
So instead, I had Claude Code create a web page that let me search the written responses, as well as filter them by who was responding (staff, parents, students, etc.), their position on redistricting (agree/disagree) etc.
As always with AI, it took a bit of back and forth to get it the way I wanted it, but I’m happy with where it is now and wanted to share with others who have been tracking this story and briefly talk about how I made it. I believe this approach can be useful in making other large PDF documents, especially ones of public interest, more accessible, digestable, and understandable to the average person.
Do not let AI interpret anything
For this project, giving Claude Code the constraint of not allowing the AI to interpret the data from the onset was the key starting point. By giving the model this rule, it proposed the searchable web page for the written responses and built it in minutes. I did add my own ideas (the click-and-drag timeline was entirely mine, for example), but the core structure of the tool that Claude made has remained basically the same since that first prompt.
Did the model still break the rule and misinterpret things? Oh god yes - in my experience Claude wants to editorialize everything, despite having no judgement skills of its own. It added verbose copy (as usual) that included false or misleading claims, like initially claiming the page allowed the user to search every written answer from all 1540 survey responses, even though only 1374 respondents filled out written answers. These errors, while annoying, were pretty easy to catch and fix, and the rule worked where it mattered, by creating a tool that stuck verbatim to the document by pulling the raw text from the PDF, splitting it into individual responses in a way the computer can process, and reproducing those as a public data file.
While extracting text from a PDF is pretty straightforward (the scripts Claude wrote for me essentially just look at the text between two questions in the survey and repeats), there were minor issues, as most PDFs are messy. For instance, the school division did make redactions to names, emails, etc. and in my explorer web page those redactions are reproduced as blank spaces. These problems were worth noting, but did not undermine the core feature of browsing the survey responses.
My main contribution to this AI tool was UX Design
Even if most of the tool was made by Claude, the edits were entirely mine - and there were a lot. Most were removing things I found unnecessary. In addition to the main response feed, Claude had added a tab to see every mention of a keyword (which was just a different view of the main feed) as well as a word count tab for what were the most common words used in the filtered responses. Testing the tool myself, I did not find these particularly useful or interesting, so I went with the “less is more” principle and cut them.
I also leaned on my journalist experience, updating language to align with how redistricting is being talked about at school board meetings and in the news. Thankfully, I am still a much better writer than Claude in general, so many revisions were to improve explanations of what the tool is and how it works.
There were also a lot of tweaks I made to how the tool looked, based on my personal preference. Claude does not have taste.
Finally, if you are not testing your AI tool, you’re contributing to the AI slop heap, in my humble opinion. I was tempted to release the tool sooner after I had checked that it worked and made all the cosmetic changes, but I stopped myself, asking “is this tool actually useful?” - not just in theory, but in practice.
After playing around with it more, I realized that my browsing of the responses benefited a lot from having the charts I created at the beginning of this project as a starting point, so I decided that in my corresponding Substack post I would include a few of those to help people get started.
UX Design is rooted in empathy, which LLMS do not have. You can outsource coding to them, but you cannot outsource understanding people.
AI accountability
In Claude’s initial build of the tool, it included a section for how the tool worked, but did not mention that it was created with AI. I added that disclaimer and moved it from a footnote to being at the top of the page (admittedly behind a toggle). To not be upfront about that, contributes to a big problem with AI, which is that despite many people using it, there’s shame around it, and so we don’t talk about it, and that hinders us grappling with this new technology.
I do have mixed feelings using AI, especially living in a state that has the largest concentration of data centers in the world. Of the many problems with AI and its risks to the economy and environment, for me the root issue is the fact that corporations are in charge of this technology’s development. Others have compared this to if the Manhattan Project had been privately run. The mass movement that has risen in reaction to AI and data centers has the potential to push for more regulation, which I wholeheartedly support.
That being said, I do believe one can be critical of AI and advocate for more regulation while still using it as a tool for the greater good, which I hope I’ve done in this case. If there was a collective boycott of the technology, I think I would probably join that, but in the meantime Claude has made it possible for me to work on projects like this where otherwise I would not have had the time.
In summary, I don’t know how I feel about it haha. But happy to talk about it with others! Email me at jwcat757 [at] gmail [dot] com if you’d like to talk AI, civic tech, or anything else. :)
Data tables
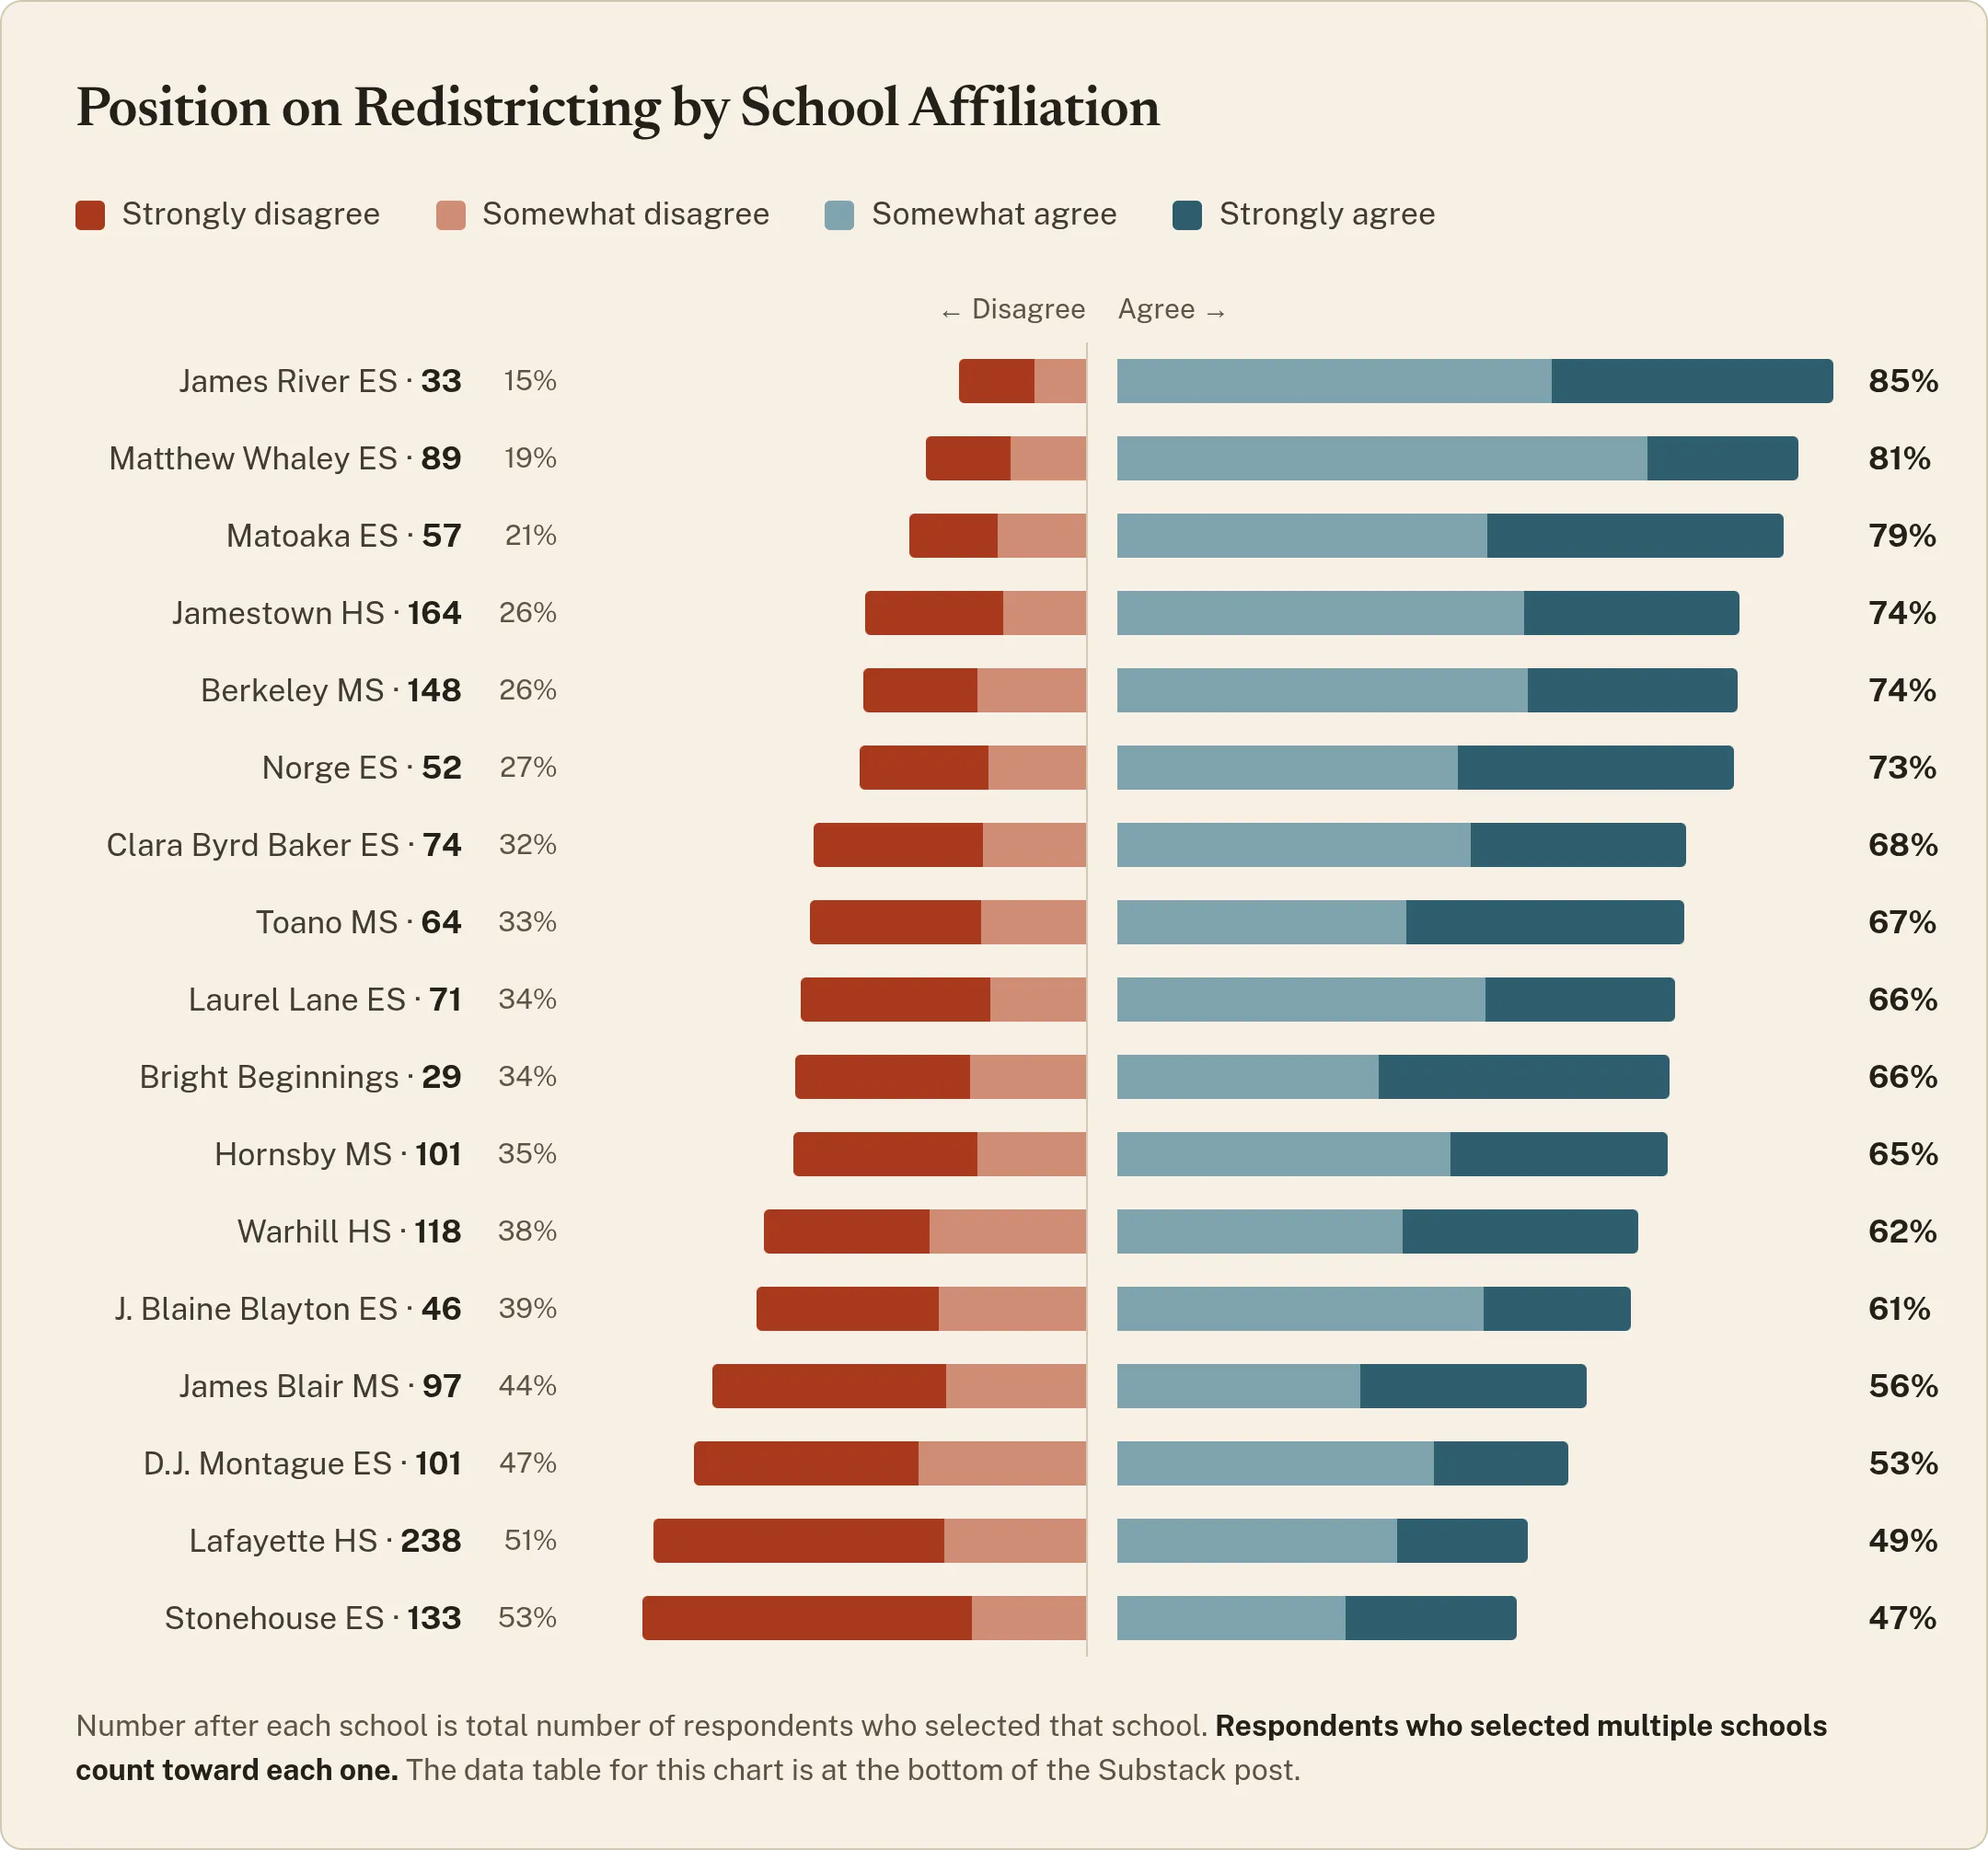
Chart 2 — Position on redistricting by school affiliation. Counts are respondents who selected that school; respondents who selected multiple schools count toward each one, so the rows sum to more than the 1,470 who answered.
| School community | Strongly agree | Somewhat agree | Somewhat disagree | Strongly disagree | Answered | Agree | Disagree |
|---|---|---|---|---|---|---|---|
| James River ES | 11 | 17 | 2 | 3 | 33 | 85% | 15% |
| Matthew Whaley ES | 16 | 56 | 8 | 9 | 89 | 81% | 19% |
| Matoaka ES | 20 | 25 | 6 | 6 | 57 | 79% | 21% |
| Jamestown HS | 42 | 79 | 16 | 27 | 164 | 74% | 26% |
| Berkeley MS | 37 | 72 | 19 | 20 | 148 | 74% | 26% |
| Norge ES | 17 | 21 | 6 | 8 | 52 | 73% | 27% |
| Clara Byrd Baker ES | 19 | 31 | 9 | 15 | 74 | 68% | 32% |
| Toano MS | 21 | 22 | 8 | 13 | 64 | 67% | 33% |
| Laurel Lane ES | 16 | 31 | 8 | 16 | 71 | 66% | 34% |
| Bright Beginnings | 10 | 9 | 4 | 6 | 29 | 66% | 34% |
| Hornsby MS | 26 | 40 | 13 | 22 | 101 | 65% | 35% |
| Warhill HS | 33 | 40 | 22 | 23 | 118 | 62% | 38% |
| J. Blaine Blayton ES | 8 | 20 | 8 | 10 | 46 | 61% | 39% |
| James Blair MS | 26 | 28 | 16 | 27 | 97 | 56% | 44% |
| D.J. Montague ES | 16 | 38 | 20 | 27 | 101 | 53% | 47% |
| Lafayette HS | 37 | 79 | 40 | 82 | 238 | 49% | 51% |
| Stonehouse ES | 27 | 36 | 18 | 52 | 133 | 47% | 53% |
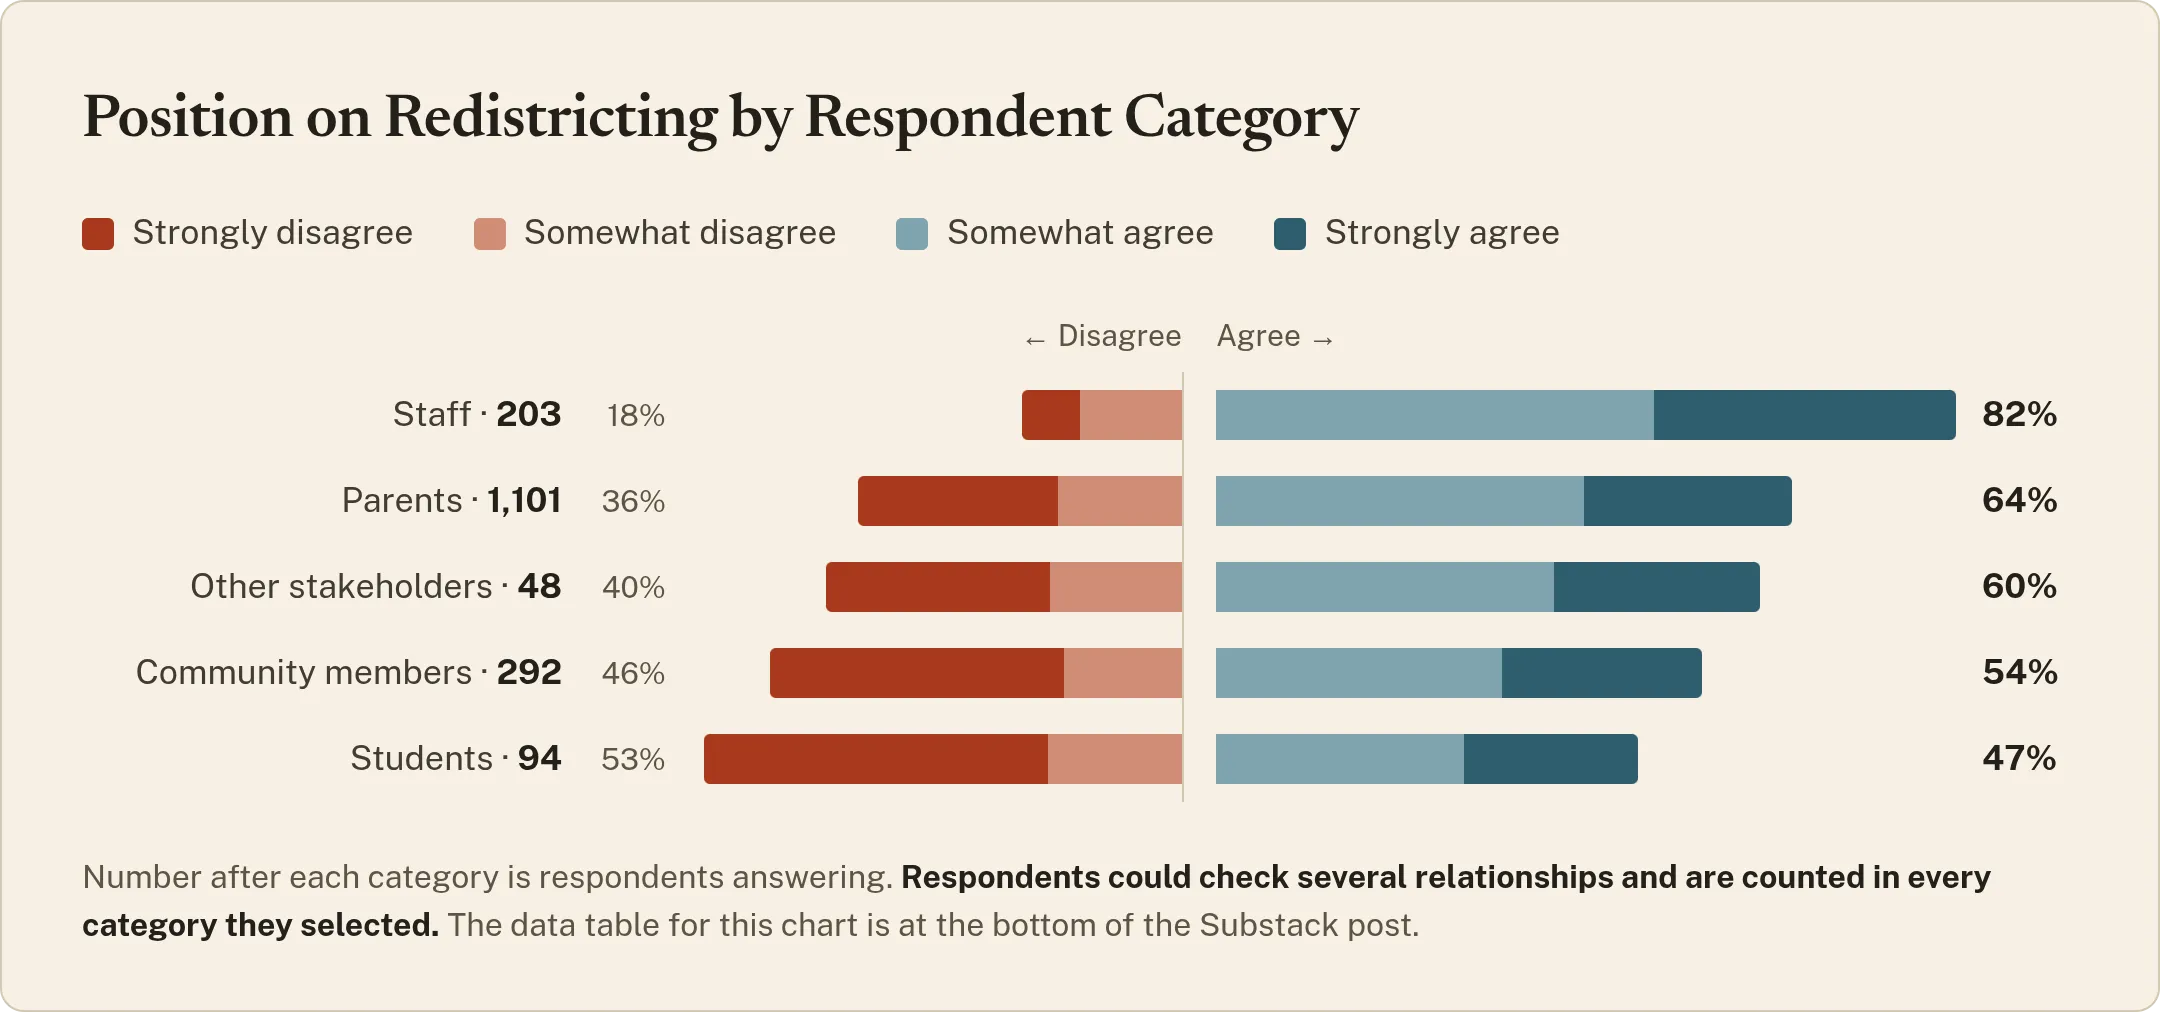
Chart 5 — Position on redistricting by respondent category. The relationship question was check-all-that-apply, so respondents are counted in every category they selected; the rows total 1,738 against 1,470 people answering.
| Respondent group | Strongly agree | Somewhat agree | Somewhat disagree | Strongly disagree | Answered | Agree | Disagree |
|---|---|---|---|---|---|---|---|
| Staff | 68 | 99 | 23 | 13 | 203 | 82% | 18% |
| Parents | 256 | 449 | 152 | 244 | 1,101 | 64% | 36% |
| Other stakeholders | 11 | 18 | 7 | 12 | 48 | 60% | 40% |
| Community members | 65 | 93 | 38 | 96 | 292 | 54% | 46% |
| Students | 18 | 26 | 14 | 36 | 94 | 47% | 53% |
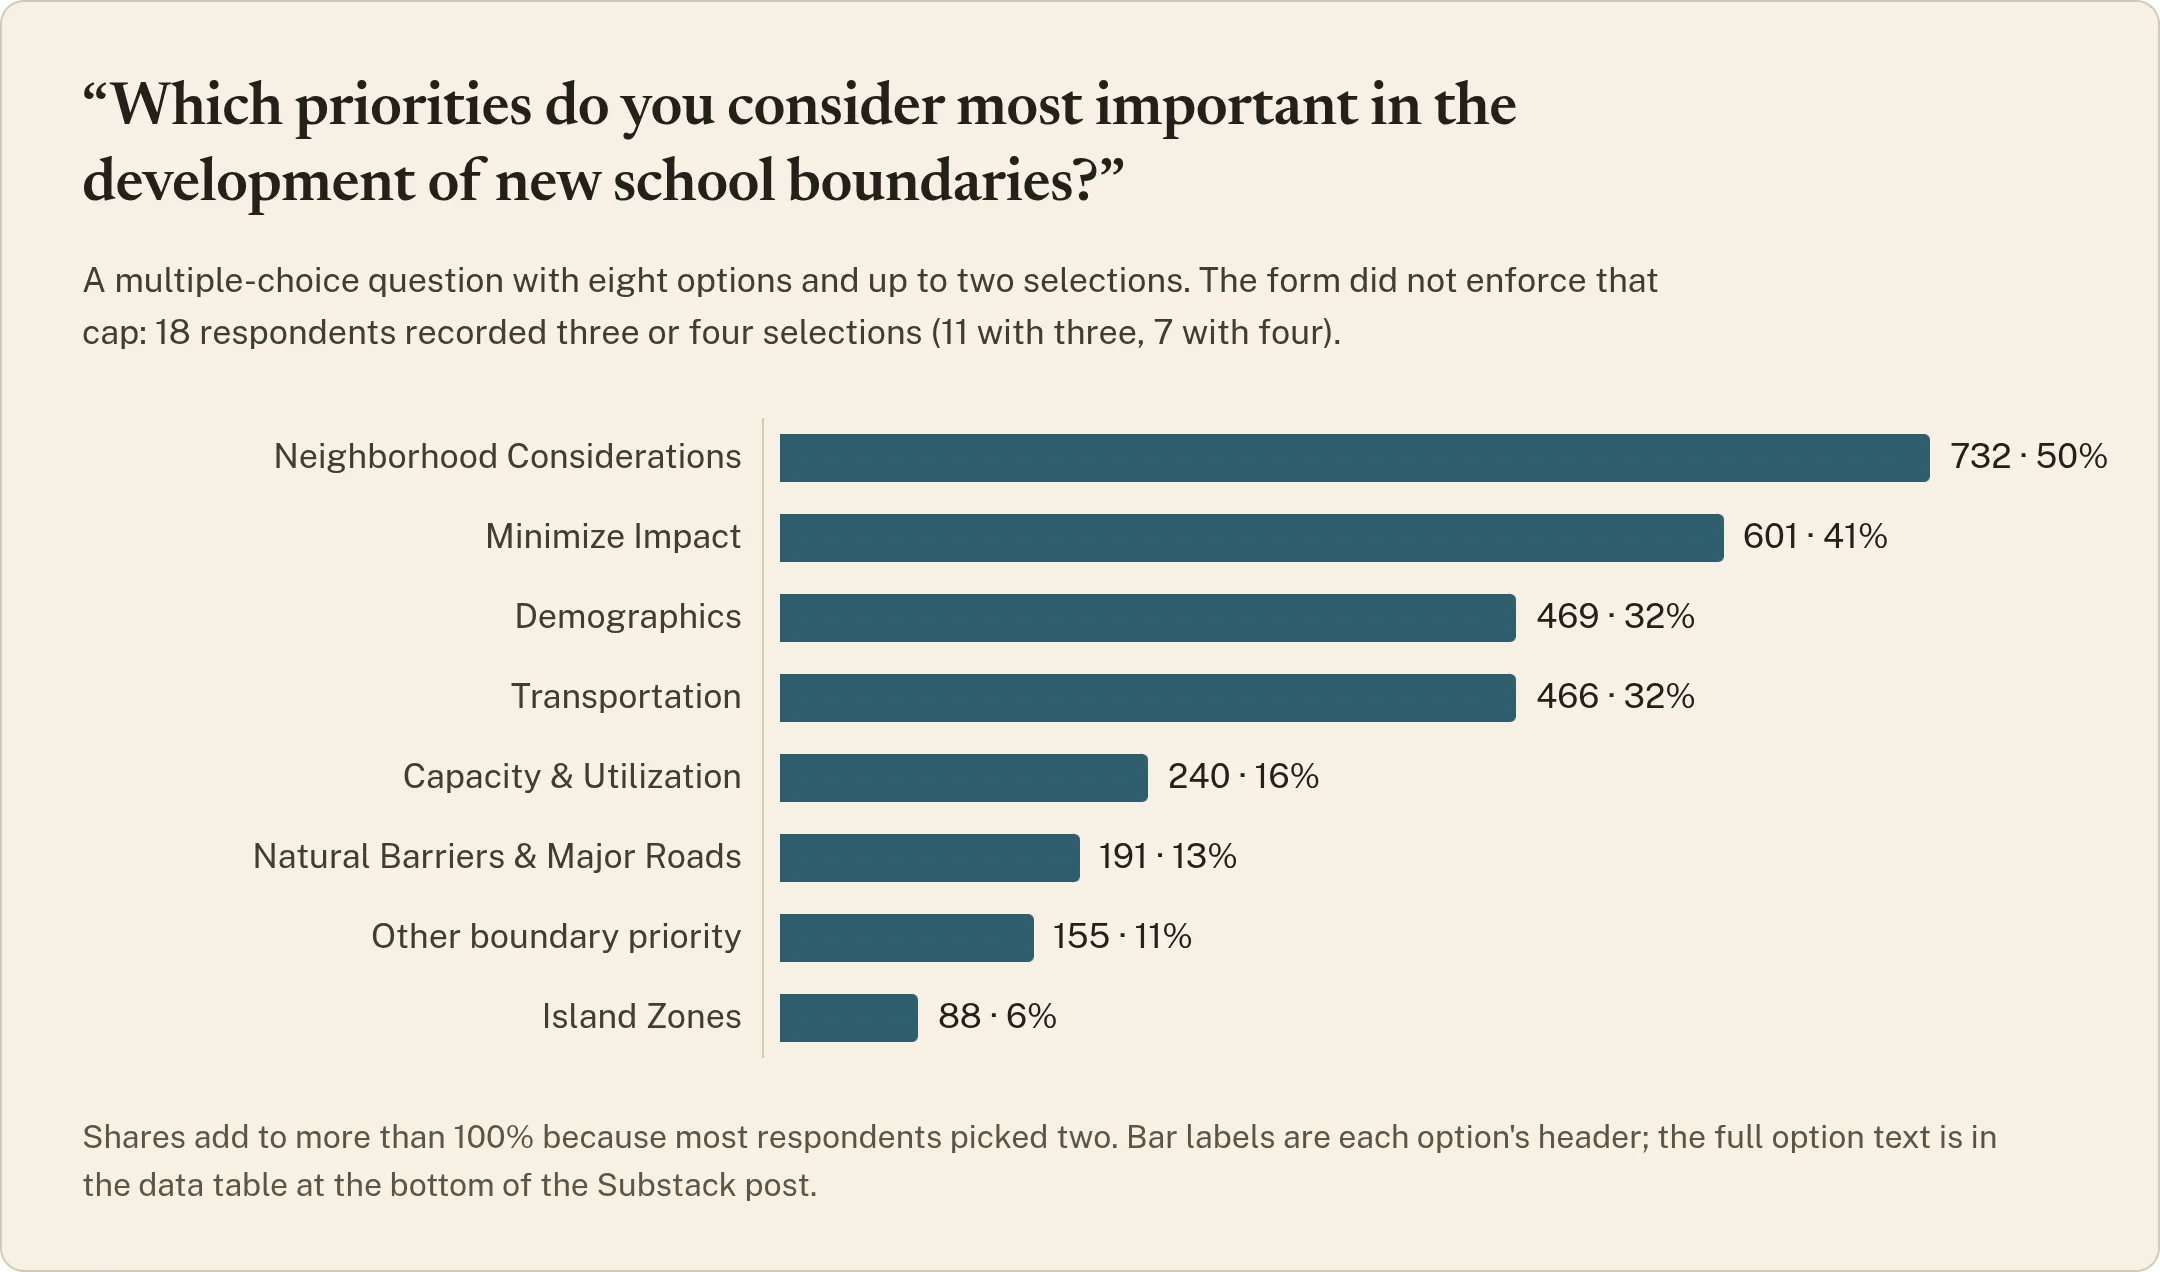
Chart 6 — “Which priorities do you consider most important in the development of new school boundaries?” Shares are of the 1,466 who answered and add to more than 100% because respondents could pick up to two. The form did not enforce the cap: 18 respondents recorded three or four selections (11 with three, 7 with four).
| Priority | Chose it | Share of 1,466 answering |
|---|---|---|
| Neighborhood Considerations | 732 | 50% |
| Minimize Impact | 601 | 41% |
| Demographics | 469 | 32% |
| Transportation | 466 | 32% |
| Capacity & Utilization | 240 | 16% |
| Natural Barriers & Major Roads | 191 | 13% |
| Other boundary priority | 155 | 11% |
| Island Zones | 88 | 6% |
The bar labels above are each option’s header. Here is the full option text as it appeared on the survey:
- Neighborhood Considerations – Keep neighborhoods together as much as possible, avoid splitting down the middle of the street.
- Minimize Impact – Move the fewest number of students to accomplish the boundary adjustment, set long term boundaries (10-12 years) accounting for known enrollment variations
- Demographics – Consider racial and ethnic diversity as well as socio-economic indicators within schools.
- Transportation – Minimize time on bus, logical safe stops for group pickups, efficiency with time and dollars
- Capacity & Utilization – Optimizing the use of school facilities to match current and projected enrollment balancing utilization at the current, 5-year, and 10-year forecasted trends.
- Natural Barriers & Major Roads – Use natural barriers and major roads to create efficiency in setting boundaries and keeping neighborhoods together.
- Island Zones – consider known enrollment variations and population projections in setting boundaries, avoid current and future islands